
Strava is no longer just a ride log or a social network for comparing segments. Lately, the platform has placed more emphasis on its training features, with one central aim: to better read the true intensity of your efforts.
For a rider who trains regularly, heart rate and power zones quickly become a foundation. Not to turn every gravel ride into a meticulously structured session, but to understand what you are really doing: easy spin, endurance, tempo a touch too hard, hard session, fatigue building up.

The strength of Strava is that it keeps this reading simple. You can track your zones over the last 7 days, the last 3 months or a full year. You can also separate disciplines: road, gravel, turbo trainer. And that is where it gets interesting, because a gravel ride and a road ride do not always stress the body in the same way, even if duration or average speed are similar.
Heart rate or power: two different readings of the same effort
Heart rate provides a physiological signal. It shows how your body responds to effort: fatigue, heat, stress, dehydration, incomplete recovery… all can influence the data.
Power, on the other hand, measures directly what you put through the pedals. It is more stable for pacing intensity, especially on a turbo trainer or on the road. In gravel, it remains very useful, but you need to accept that terrain, accelerations, vibrations and changes in traction can make the reading less linear at times.

The point is therefore not to choose between heart rate and power. It is to combine both. A steady power with a heart rate that drifts a lot can signal fatigue, a lack of endurance, poor hydration or a ride that is too long for how you felt that day. Conversely, an unusually low heart rate with poor sensations can also indicate that something is off.
Understanding the five training zones in Strava
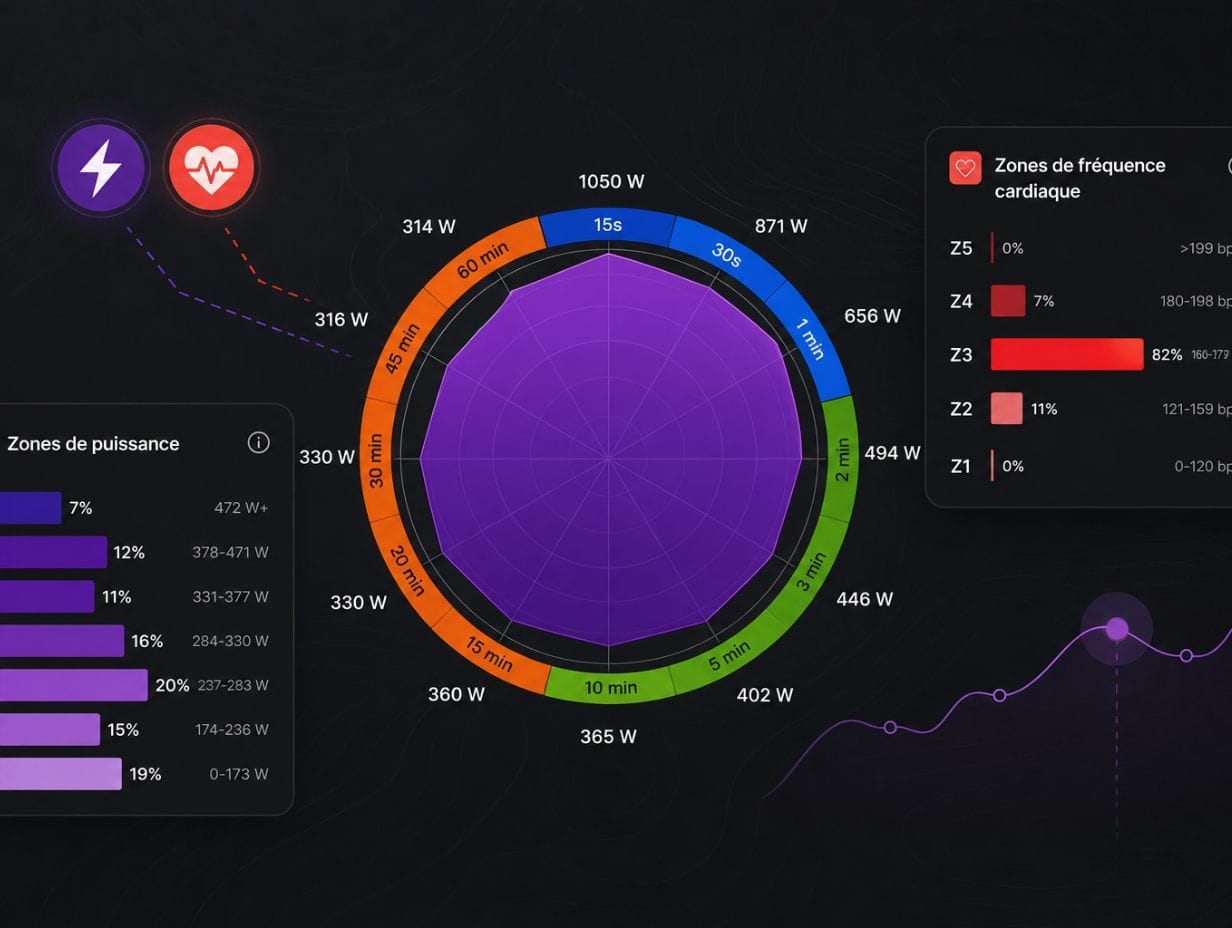
Strava splits your efforts into five zones. They can autocalibrate from your activities, but you can also adjust them manually, notably from your maximum heart rate or your power reference values.
In simple terms, the lower zones correspond to easy to moderate efforts. The higher zones correspond to hard, short or very demanding intensities. This breakdown is not just for show: it lets you see where your training time really goes.

Zone 1 is mainly for recovery or very easy riding. Zone 2 generally corresponds to base endurance, the one we often try to develop to last longer, handle more volume and build a solid base.
Zone 3 is more of a trap. It often feels like you are working well, because the effort is steady but still controllable. The problem is that by spending too much time there, you accumulate a lot of fatigue without necessarily getting the targeted benefit of a truly hard session or a truly easy ride.

Zones 4 and 5 are the intensity zones. They have their place, of course, but rather in structured sessions: intervals, short efforts, threshold work, surges, paced climbs. The classic trap is riding too hard too often, but never precisely enough.
What to check first after a ride
After an activity, the useful reflex is not just to check the average speed, elevation gain or segments. Above all, look at how your time was distributed across the zones.
If a ride announced as easy contains a lot of zone 3 or zone 4, it probably was not that easy. If a hard session barely raises intensity, it may not have hit its target. And if your long gravel rides systematically generate a lot of cardiac fatigue, you may need to review your pacing, your nutrition or your recovery.

On Strava, the view becomes interesting across several time scales. The last 7 days show the recent load. The last 3 months give a more robust trend. The full year helps you understand your progression, your breaks and your overload periods.
This time-based reading is what counts. A one-off ride can be misleading. A pattern that repeats, much less so.
Compare road, gravel and turbo trainer without mixing all your efforts
One genuinely practical point in Strava is the ability to differentiate zones by discipline. For a rider who trains on the road, in gravel and on a turbo trainer, that is far from a detail.
On the road, effort can be more continuous. In gravel, accelerations, surface changes, technical sections and irregular climbs can make power and heart rate vary. On a turbo trainer, the environment is more controlled, but heat stress and the “lack of freewheeling” can change the sensations.

The same rider can therefore have a different intensity distribution depending on the discipline. Gravel can generate more spikes. The turbo trainer can make sessions cleaner. The road can make tempo or threshold work easier.
Zone 3: effective, but to be watched
Zone 3 deserves its own paragraph because it is often where many cyclists spend too much time. It is comfort in discomfort: you feel you are pushing, you are moving well, it feels like a good session.
The issue is that it can become a grey zone. Not easy enough to truly recover or properly develop base endurance. Not hard enough to trigger the adaptations targeted by threshold or VO2 max work.

That does not mean you should banish zone 3. Some goals can target it. Some rolling or gravel rides naturally take you there. But if all your rides end up looking the same, with lots of zone 3 and little true intensity, your progression is likely to plateau.
The aim is not to ride slowly all the time. The aim is to give each ride a clear purpose.
Power Capacities: read your rider profile
With data from a power meter or a smart trainer, Strava can go further thanks to the Power Capacities feature. It analyses your ride history and classifies your efforts into three big families: Sprint, Attack and Climb.
Sprint covers very short efforts: 15 seconds, 30 seconds and 1 minute. It is your explosiveness, useful for a surge, an exit from a bend, a very short rise or a sprint.

Attack covers efforts from 2 to 10 minutes. It is a very interesting zone for short climbs, changes of pace, efforts to close a gap or to maintain a high intensity on a demanding section.
Climb groups long efforts: 15, 20, 30, 45 and 60 minutes. It is the ability to hold high power for a sustained period, on a climb, a long false flat, a rolling section or an effort close to threshold.

This view is useful because it avoids reducing your level to a single value. Two riders can have a similar FTP but very different profiles: one very explosive, the other much stronger on long efforts. To guide training, that is valuable information.
To get a reliable analysis of Power Capacities, you need consistent power data. So a power meter on the bike or a compatible smart trainer. Without that, Strava cannot conjure up a solid curve.
That is an important limitation. Heart rate is enough to track overall intensity and training load, but power adds extra precision, especially for comparing short efforts or measuring progress on specific intervals.

In gravel, power meter pedals are becoming an increasingly credible option. For example, we tested the Favero Assioma Pro MX-2, with the clear advantage of easy installation and measurement directly at the pedals.
That said, a poorly calibrated meter, inconsistent data or an incompletely filled Strava profile can skew the analysis. Before drawing conclusions, check your personal information, your weight, your zones and the consistency of your activities.
Power Curve: track your best efforts without fooling yourself
Strava’s Power Curve lets you visualise your best average power outputs over different durations. It does not just say how much you produced in a sprint or over twenty minutes. It shows your effort profile across a much wider range.
It is very useful for spotting what is really improving. You can compare a full year, the last six weeks or a specific period. If your 5-minute power is climbing but your long endurance is stagnating, your training is not having the same effect as if your 30 or 60-minute power is improving.

The key nuance: the Power Curve depends on your recorded bests. It can therefore be influenced by a very favourable ride, a specific test or, on the contrary, by a lack of recent maximal efforts. It gives a trend, not an absolute truth about your level today.
Fitness: useful, but not a magic overtraining detector
Strava’s Fitness feature uses effort measurement, based on heart rate or perceived exertion, as well as power data when available. It lets you track how your training load and fitness change over time.
It is handy for visualising cycles: periods where you increase the volume, phases where you back off, moments where form gradually returns. The score is personal. It is used to compare your own periods, not to compare yourself with other cyclists.

You also need to keep a limit in mind: a rising score does not necessarily mean you are fresh. Strava even specifies that Fitness does not necessarily indicate periods of overtraining. To assess that, you need to cross-check with effort measurement, sensations, sleep, recovery and a load that is increasing too quickly.
And this is still a small limitation in Strava today: the app does not import all the information recorded by your watch (if you wear one), such as sleep, stress level, etc.
How to use Strava in practical terms over a training week
To make the tool useful, start with a simple question: what was the aim of the week? Build endurance? Recover? Add a hard session? Prepare for a long event?
If you are in a base week, you should see a lot of time in zones 1 and 2, with little intensity. If you have planned a quality session, the higher zones should appear clearly, but without contaminating all the other rides.

After 7 days, look at the overall distribution. After 3 months, check whether your capacities are evolving. Over a year, observe the big periods: restart, peak form, break, overload, progression.
This reading helps you avoid steering training only by feel or the motivation of the moment. It also helps you understand why you are tiring: sometimes, it is not one big ride that causes problems, but the accumulation of slightly-too-hard rides.
Common mistakes to avoid
The first mistake is never setting your zones. If your maximum heart rate or your power references are wrong, the whole analysis becomes approximate.
The second is comparing your fitness score with someone else’s. This metric is tied to your profile, your history and your load. It is not meant to become a leaderboard.

The third is to take every chart as a medical or sporting absolute truth. Strava provides a very accessible reading, but it is less specialised than some dedicated training platforms. That is exactly its strength: less complexity, more clarity.
The fourth, finally, is looking only at successful efforts. A drop in power, heart rate drift or unusual fatigue are also information. Sometimes, they are worth more than a new personal record.
Strava becomes a real tracking tool, as long as you stay clear-eyed
Strava now offers training analysis that is sufficiently comprehensive for the majority of serious amateur cyclists. Zones, the Power Curve, Power Capacities and Fitness already provide a solid base for understanding your riding.
It is not as in-depth as a specialised platform, and it is not meant to replace a coach for a very specific goal. But the experience is smooth, especially on mobile, and the data are presented clearly.
The right way to use Strava, ultimately, is not to control everything. It is to read better what your rides already tell you. And sometimes they say something quite simple: riding less often in the grey zone can help you progress more effectively.